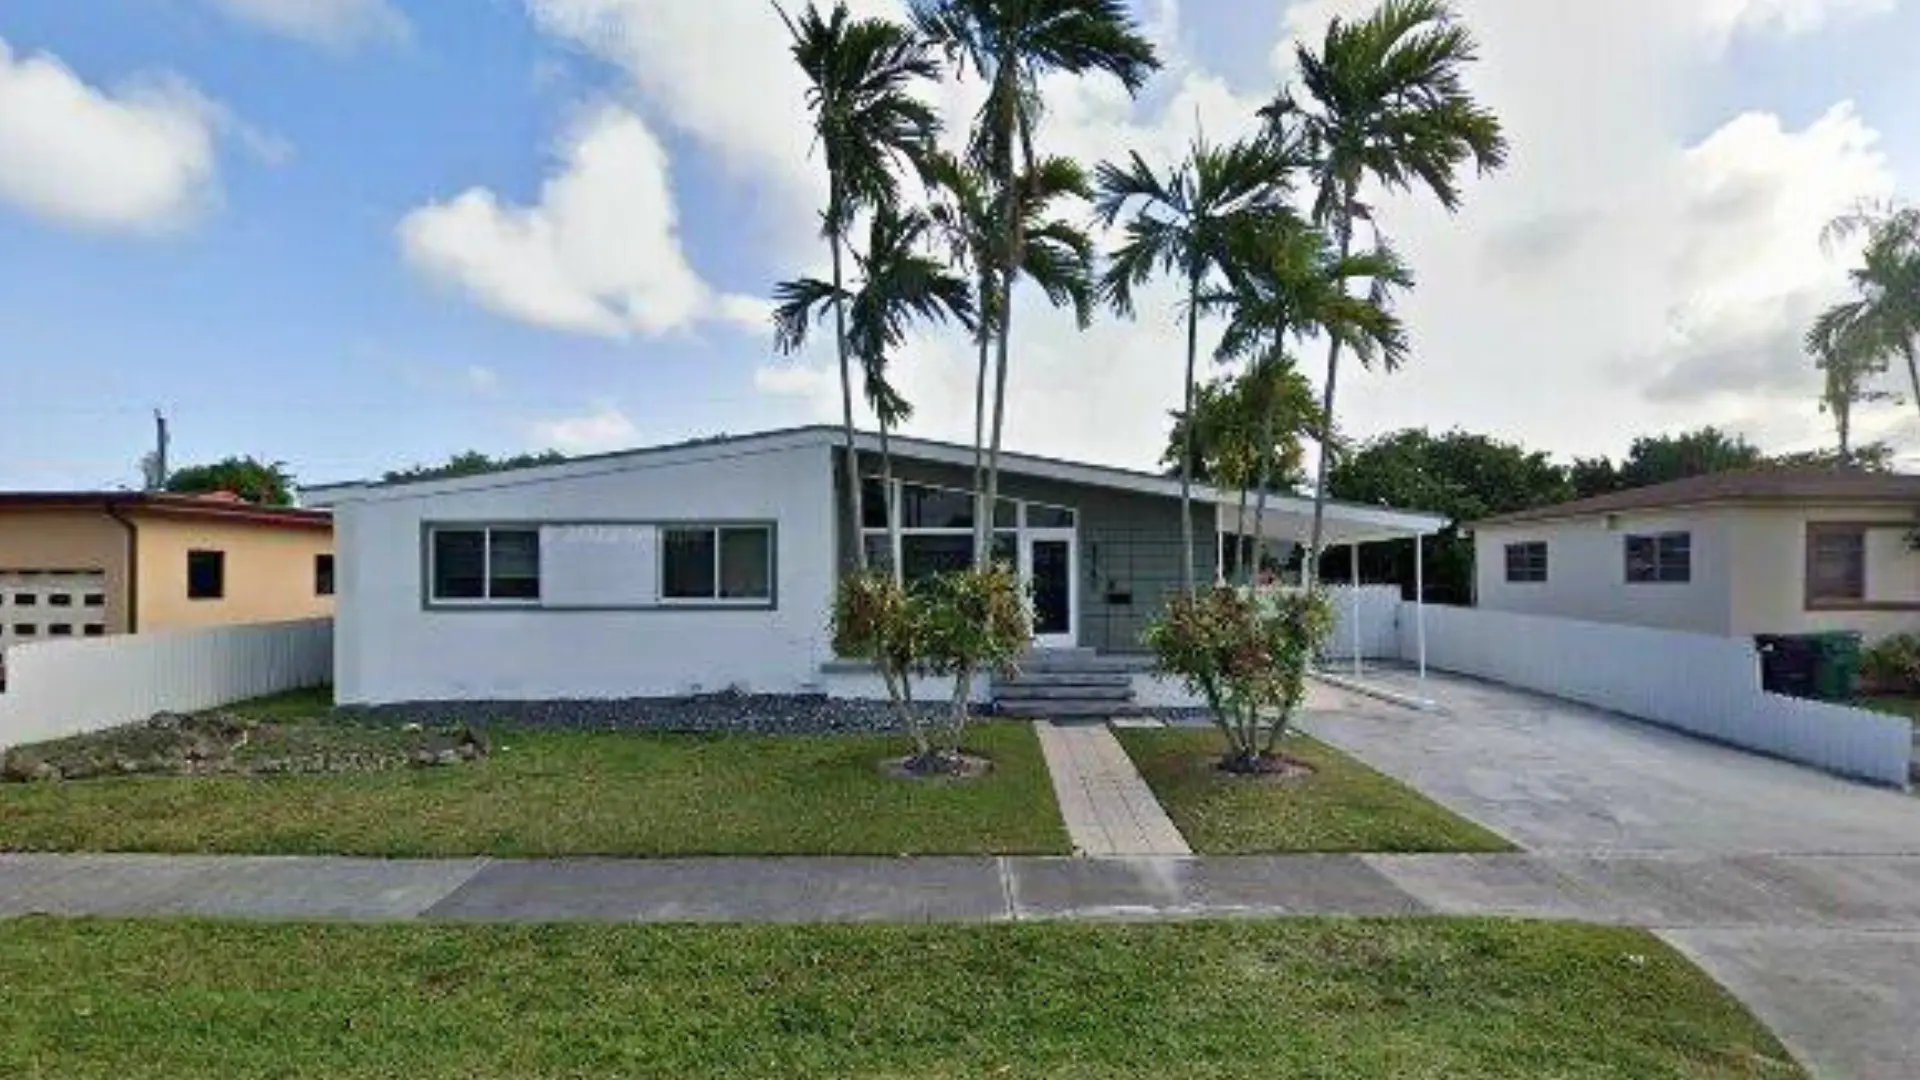
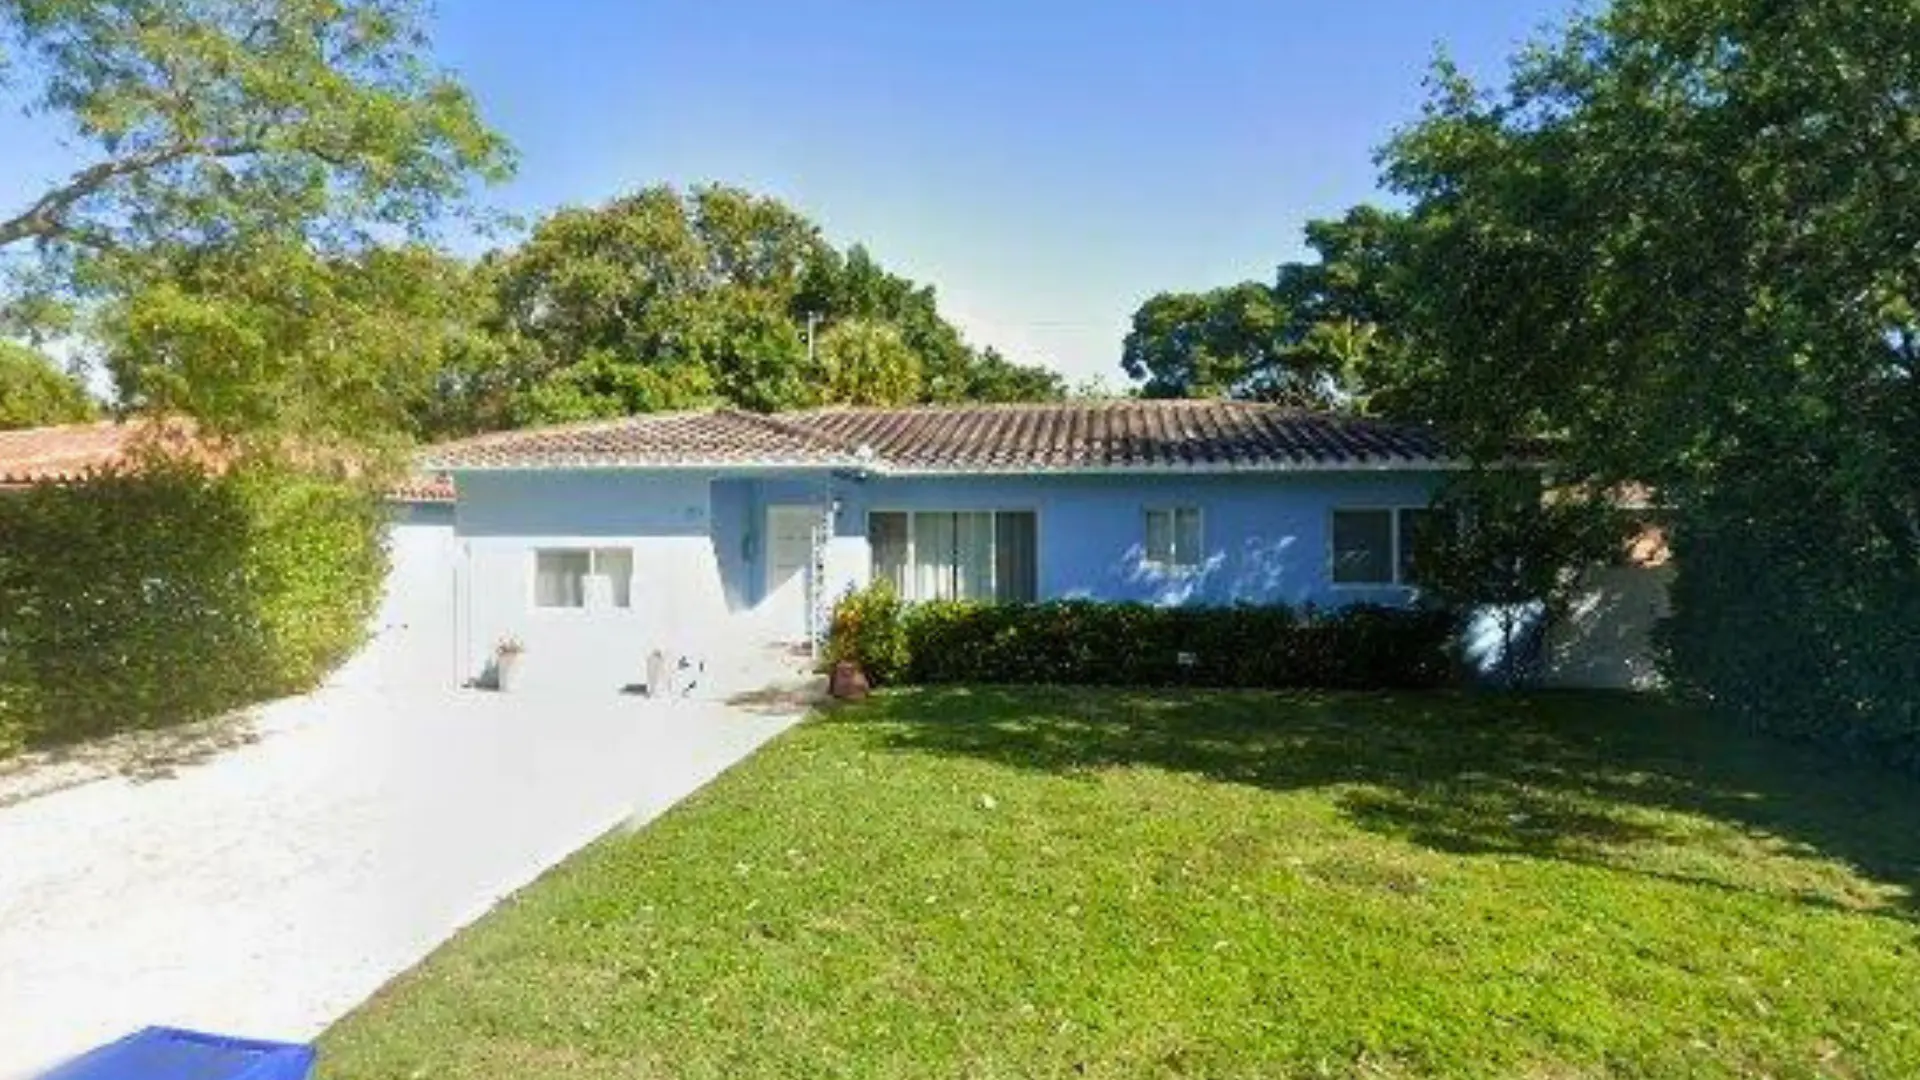
FinancialDistressMapping ForSmarterAcquisitions

Demo Properties
6 Properties


View Custom Lists
Browse live feeds from the last 3 months, explore presets, manage your lead lists, and access static snapshot lists you createβall in one place.
- View Presets.
- Access our curated preset lists that automatically track distressed properties from the last 3 months, updated daily with the latest filings.
- View Custom Lists.
- Set your own filters to create custom lists, build targeted lead lists, and visualize them all on the interactive map.


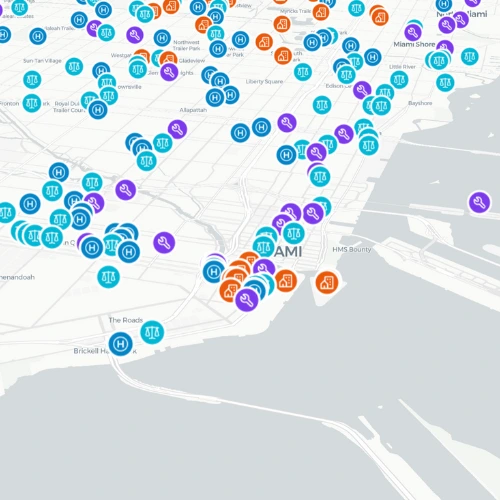
Powerful Controls at Your Fingertips
Every tool you need to filter, organize, and visualize distressed propertiesβaccessible instantly from the map interface.
- Favorites & Archive.
- Quickly save properties you're interested in to Favorites, or Archive ones you've reviewed to keep your workspace clean and organized.
- Lead Management.
- Build and manage targeted lead lists directly from the map. Filter by your active leads to focus on high-priority opportunities.
- 2D & 3D Views.
- Switch between flat 2D mapping and immersive 3D visualization to analyze properties from every angle.
Census Data Layers
Layer demographic insights directly on the map. Analyze population trends and income levels to make data-driven decisions about where to invest.
- Population Density.
- Visualize population distribution across neighborhoods to identify high-density areas with greater investment potential and market demand.
- Median Income.
- Overlay income data to understand the economic profile of each area, helping you target properties in neighborhoods that match your investment criteria.
Visualize Every Opportunity with Unmatched Precision
Choose Your Investment Plan
Now Available in Miami-Dade County
Free
Best for: Anyone exploring off-market real estate opportunities
Basic
Most PopularBest for: Part-time agents, wholesalers & real estate investors
Pro
Best for: Full-time agents, wholesalers & fix-and-flip investors
EnterpriseSolutionsBuilt for YourBusiness

